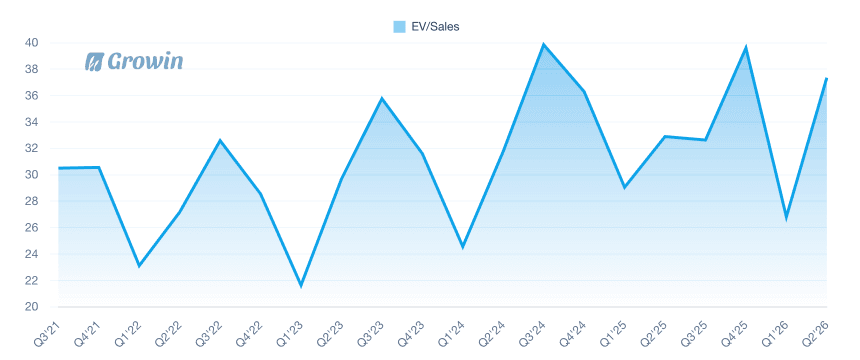
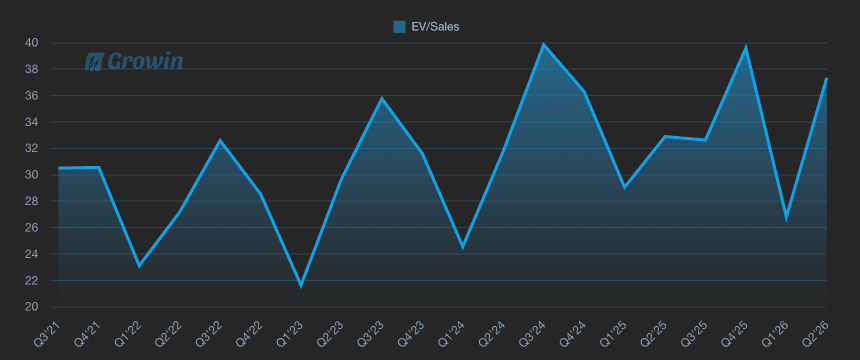
TSLA EV/Sales
Browsing restrictions can be lifted for a fee.
Browsing restrictions can be lifted for a fee.
The latest data point for TSLA's EV/Sales ratio in Q1'26 stands at 53.37, reflecting a moderation from the peak of 62.45 observed in Q4'25, yet remaining elevated compared to earlier periods. Over the timeframe from Q2'23 to Q1'26, the EV/Sales ratio exhibits a clear upward trend, starting at 33.74 and climbing steadily to 62.45 by Q4'25, with notable acceleration in the latter half of the period driven by market optimism around TSLA's growth prospects. This area chart highlights periods of volatility, including a brief dip to 23.72 in Q4'23 followed by consistent recovery and expansion, underscoring the metric's sensitivity to valuation shifts in the EV sector. Overall, the trajectory suggests sustained premium pricing relative to sales, though the recent pullback in Q1'26 may signal emerging caution among investors.