TSLA EV/EBITDA

Browsing restrictions can be lifted for a fee.
Browsing restrictions can be lifted for a fee.
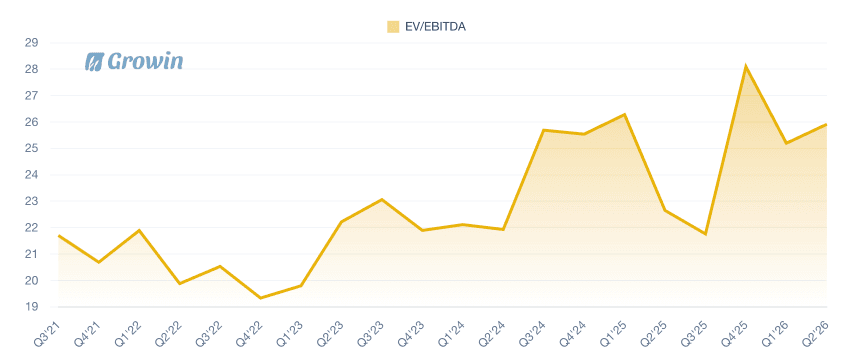
The latest data point for TSLA's EV/EBITDA ratio in Q1'26 stands at 1422.46, marking a substantial increase from the previous quarter's value of 132.87 in Q4'25 and indicating heightened market valuation relative to earnings before interest, taxes, depreciation, and amortization. Over the period from Q2'23 to Q1'26, the EV/EBITDA ratio exhibits a volatile yet predominantly upward trend, starting at 47.66 in Q2'23 and declining initially to a low of 36.92 in Q1'24 before surging to peaks of 1422.46 in Q1'26. Notable inflection points include a sharp rise from 36.92 in Q1'24 to 87.37 in Q4'24, followed by continued escalation with intermittent fluctuations, such as a dip to 57.46 in Q1'25 before climbing to 132.87 in Q4'25. This pattern suggests growing investor expectations for TSLA's future profitability amid operational expansions, though the extreme recent levels may signal overvaluation risks in the EV sector.