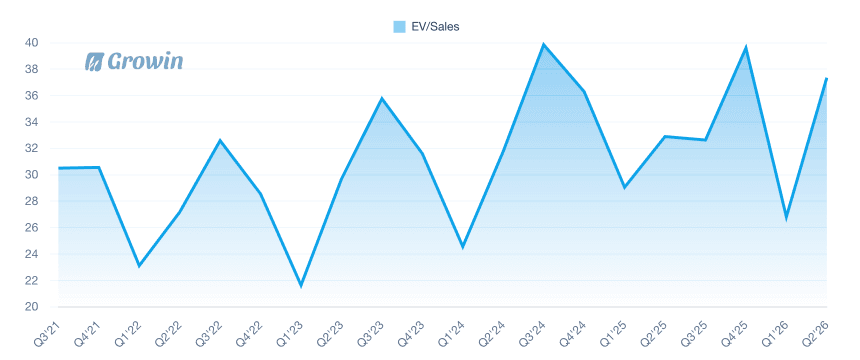
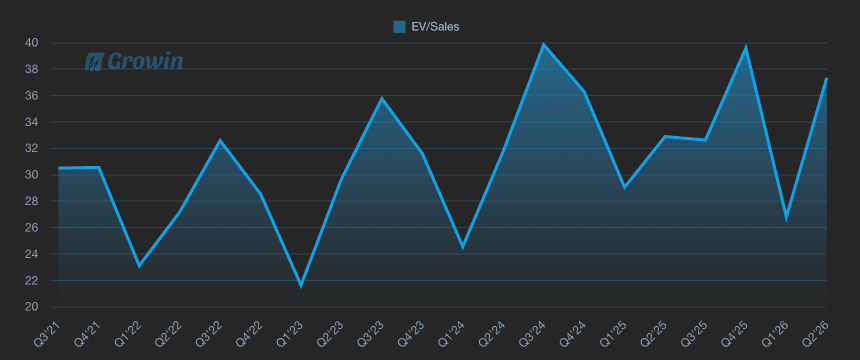
AMD EV/Sales
Browsing restrictions can be lifted for a fee.
Browsing restrictions can be lifted for a fee.
The latest data point for AMD's EV/Sales ratio in Q1'26 stands at 31.96, reflecting a slight uptick of approximately 1% from the previous quarter's 31.62 in Q4'25, indicating a modest stabilization after earlier declines. Over the period from Q2'23 to Q1'26, the EV/Sales ratio exhibited significant volatility, peaking at 45.03 in Q3'25 before dropping sharply to a low of 21.70 in Q1'25, with an overall downward trend from an initial high of 32.78 in Q2'23 to the current level. Notable inflection points include a surge to 43.78 in Q4'23, followed by a gradual decline through Q3'24 at 35.12, and a rebound in late 2025, underscoring market fluctuations potentially tied to AMD's growth expectations and sector dynamics in this area chart representation.