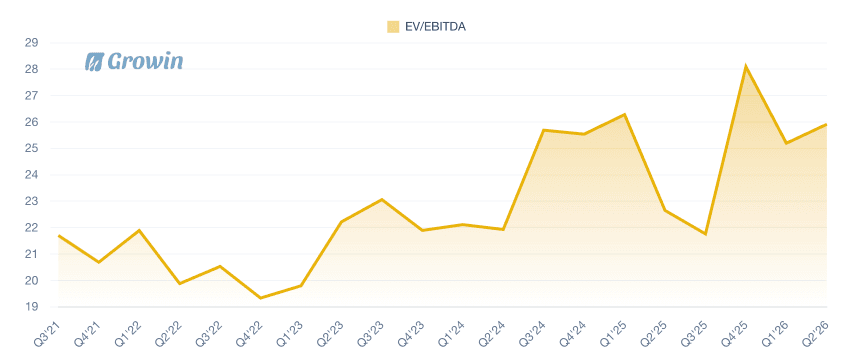
AMD EV/EBITDA

Browsing restrictions can be lifted for a fee.
Browsing restrictions can be lifted for a fee.
The latest data point for AMD's EV/EBITDA ratio in Q1'26 stands at 222.04, marking a substantial surge from the previous quarter's value of 44.08 in Q4'25 and indicating heightened market expectations for future earnings growth relative to enterprise value. Over the period from Q2'23 to Q1'26, the EV/EBITDA ratio exhibited significant volatility, starting at 42.95 in Q2'23 and climbing sharply to 64.83 in Q4'23 before declining to a low of 27.00 in Q1'25, reflecting periods of market optimism followed by valuation corrections. Subsequent quarters showed renewed fluctuations, with a peak of 65.88 in Q3'25 and the dramatic rise to 222.04 in Q1'26, suggesting an overall upward trend in multiples driven by potential improvements in EBITDA projections or stock price appreciation, though analysts should monitor for sustainability amid the area's inherent sensitivity to earnings volatility.