
U EV/EBITDA
Browsing restrictions can be lifted for a fee.
Browsing restrictions can be lifted for a fee.
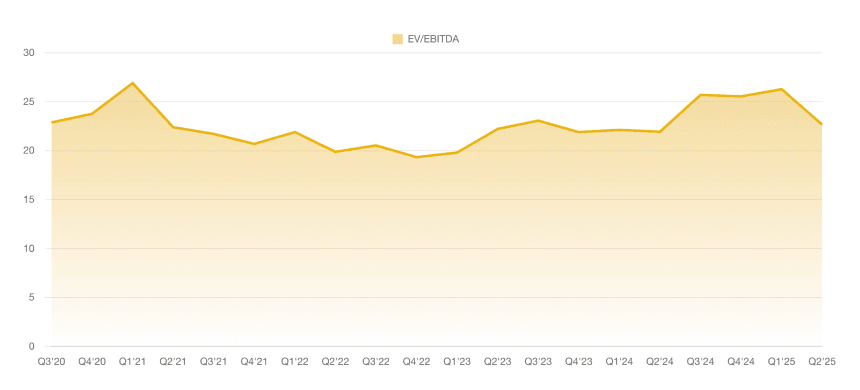
In the latest data point for Q1'26 , Unity Software ( U ) recorded an EV/EBITDA ratio of -43.99 . This represents a significant recovery compared to the deep negative valuation seen in the preceding quarter. Throughout the period from Q2'23 to Q1'26 , the EV/EBITDA ratio remained consistently in negative territory, reflecting persistent challenges in reaching positive earnings. The trend showed a drastic decline starting in Q1'25 , reaching a historical low of -487.58 in Q4'25 , before experiencing a sharp rebound in the most recent fiscal period.