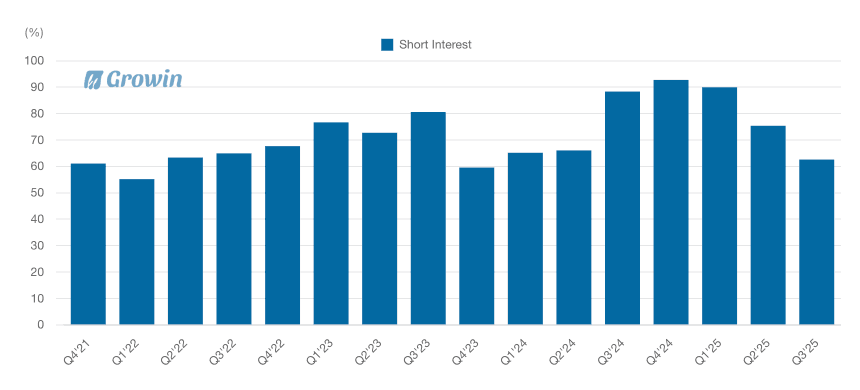
TSLA Short Interest
Browsing restrictions can be lifted for a fee.
Browsing restrictions can be lifted for a fee.
The latest data point for TSLA Short Interest as of 2026-05-15 is 2.63%. This represents a notable increase compared to the mid-quarter lows observed earlier in the year. The chart data from 2025-11-28 to 2026-05-15 reveals a fluctuating trend, initially declining from 2.69% to a period low of 1.82% by 2026-03-13. However, short interest experienced a significant rebound throughout the second quarter of 2026, climbing back toward the 2.6% level, which suggests shifting market sentiment and increased hedging activity during this period.