
SNOW EV/EBITDA
Browsing restrictions can be lifted for a fee.
Browsing restrictions can be lifted for a fee.
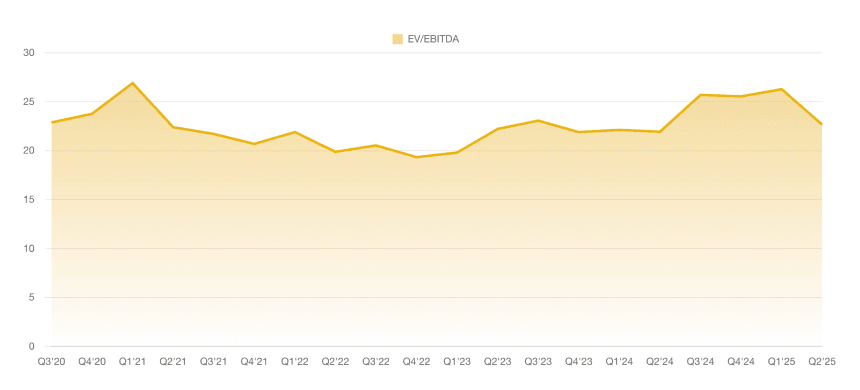
The latest data point for SNOW's EV/EBITDA ratio in Q4'26 stands at -219.709, indicating a significant deepening of negative valuation relative to earnings before interest, taxes, depreciation, and amortization, which may reflect ongoing profitability challenges or market expectations of future growth. Over the period from Q1'24 to Q4'26, the EV/EBITDA ratio has exhibited a volatile yet predominantly negative trend, starting at -77.767 and fluctuating between -46.364 (Q2'25, the least negative) and -219.709 (Q4'26, the most severe), with a general worsening after mid-2025 that suggests increasing investor skepticism toward the company's operational efficiency and cash flow generation in this area chart representation.