
MRVL EV/EBITDA
Browsing restrictions can be lifted for a fee.
Browsing restrictions can be lifted for a fee.
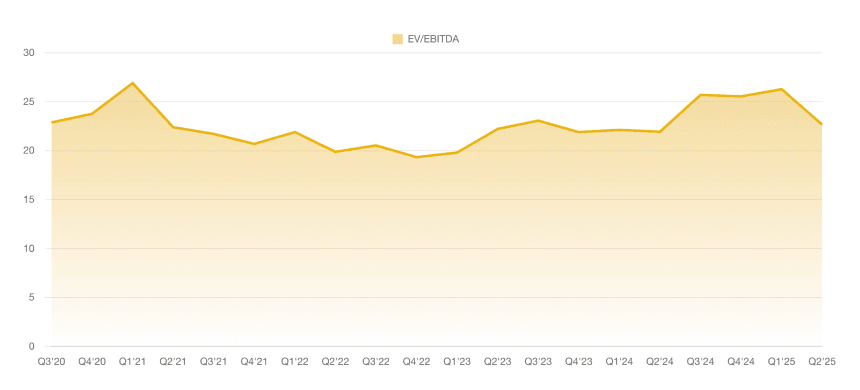
The latest data point for MRVL's EV/EBITDA ratio, recorded in Q4'26, stands at 17.821, reflecting a significant contraction from prior periods and indicating improved valuation relative to earnings. Over the period from Q1'24 to Q4'26, the EV/EBITDA ratio exhibited a volatile upward trend initially, rising sharply from 43.144 in Q1'24 to a peak of 262.148 in Q3'25, driven by potential market optimism or operational challenges. This was followed by a pronounced decline, dropping to 40.504 in Q2'26 and further to 17.821 in Q4'26, suggesting enhanced profitability, reduced enterprise value, or sector-wide adjustments that have made the stock appear more attractively valued on an earnings basis. Overall, the area chart highlights a transition from elevated multiples to more normalized levels, warranting monitoring for sustained downward momentum.