
MPWR EV/EBITDA
Browsing restrictions can be lifted for a fee.
Browsing restrictions can be lifted for a fee.
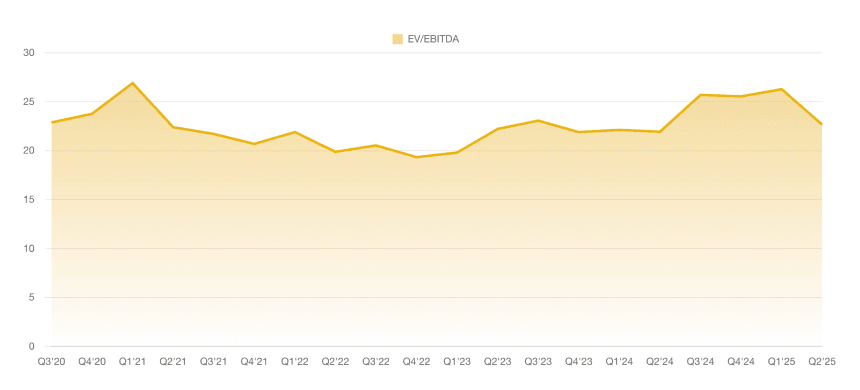
The latest data point for MPWR's EV/EBITDA ratio, recorded in Q1'26, stands at 218.19, marking a substantial surge from the previous quarter's value of 67.21 in Q4'25 and indicating heightened market valuation relative to earnings. Over the period from Q2'23 to Q1'26, the EV/EBITDA ratio exhibited volatility with an overall upward trajectory, starting at 43.41 in Q2'23 and peaking at 218.19 in Q1'26; notable declines occurred in Q3'24 to 41.00 and Q4'24 to 44.34, followed by a recovery and acceleration in growth from Q1'25 onward, suggesting increasing investor optimism or expansion expectations despite intermittent corrections. This area chart highlights periods of stability around 40-60 in mid-2023 and late 2024, contrasting with the sharp rise post-Q4'25 that could signal potential overvaluation risks for financial analysts to monitor.