
MCD EV/EBITDA
Browsing restrictions can be lifted for a fee.
Browsing restrictions can be lifted for a fee.
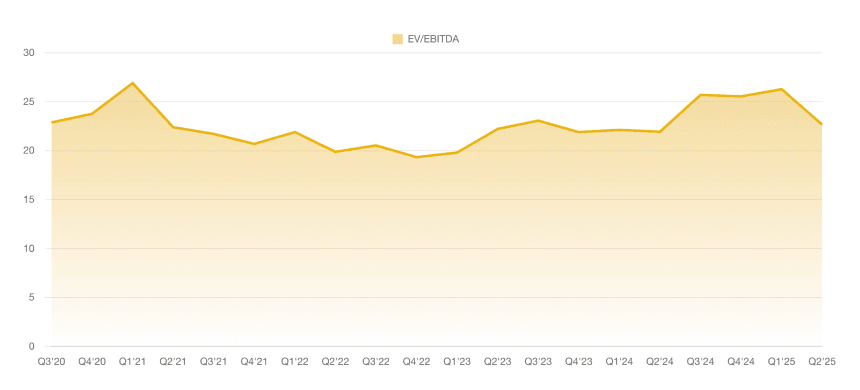
The latest data point for MCD's EV/EBITDA ratio in Q1'26 stands at 89.94, marking a substantial surge from the prior quarter's value of 19.80 in Q4'25 and indicating heightened valuation relative to earnings before interest, taxes, depreciation, and amortization. Over the period from Q2'23 to Q1'26, the EV/EBITDA ratio exhibited relative stability, fluctuating between a low of 17.32 in Q1'24 and a high of 19.80 in Q4'25, with an overall average around 18.8 that suggests consistent market pricing for MCD's operational performance. This steady trend, visualized in an area chart, underscores minimal volatility until the abrupt elevation in Q1'26, potentially signaling a significant shift in investor expectations or external factors impacting enterprise value.