
LULU EV/EBITDA
Browsing restrictions can be lifted for a fee.
Browsing restrictions can be lifted for a fee.
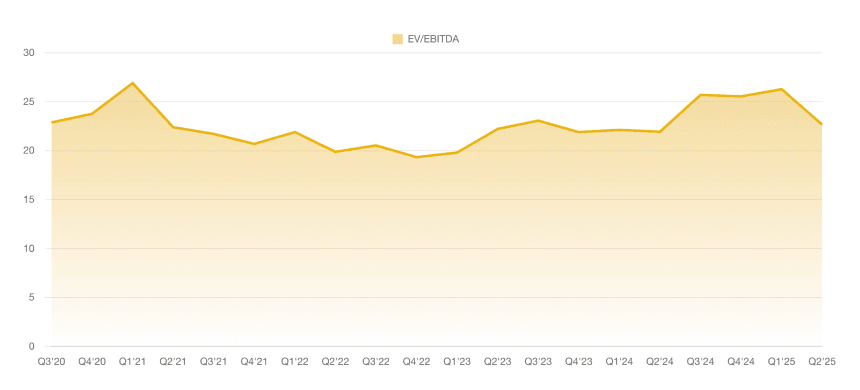
The latest data point for LULU's EV/EBITDA ratio, recorded in Q4'26, stands at 6.43, reflecting a continued compression in valuation multiples compared to prior periods. Over the period from Q1'24 to Q4'26, the EV/EBITDA ratio exhibited an initial upward trend, peaking at 29.366 in Q3'24, before entering a sustained decline to 6.43 by Q4'26, indicating improving operational efficiency or market reassessment of growth prospects. This downward trajectory, particularly sharp from Q3'24 onward with a drop of over 78% from the peak, suggests reduced investor expectations for future earnings relative to enterprise value, though the area chart highlights periods of relative stability in Q1'26 to Q3'26 around the mid-teens before the final dip.