Join Growin Stock Community!
Beta
Back to DPZ.US Analysis

Ticker

Value

empty

There is no following symbol in this watchlist.

  • P/E Ratio
  • P/S Ratio
  • P/B Ratio
  • EV/EBITDA
  • EV/Sales
  • PE Ratio River
ev-to-ebitda-chart

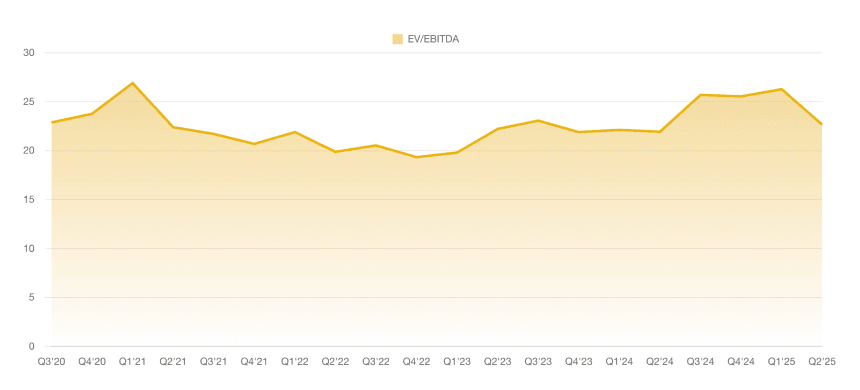
DPZ EV/EBITDA

EV/EBITDA

Browsing restrictions can be lifted for a fee.

This disclaimer is provided by TradingValley Inc. and includes any messages, news, research, analysis, prices or other information provided by the Company's website, the application "Growin App" and other services provided through the Company's website. It is only general market information for educational and investment decision-making reference, and does not constitute any investment advice. View Growin Disclaimer

The latest data point for DPZ in Q1'26 shows an EV/EBITDA ratio of 15.203. This represents the lowest valuation multiple recorded throughout the entire observed period. From Q2'23 to Q1'26, the EV/EBITDA ratio exhibited a volatile but ultimately downward trend. After peaking at 24.477 in Q1'24, the valuation has steadily contracted, reflecting a significant compression in the company's enterprise value relative to its earnings power over the last several fiscal quarters.