
CRNC EV/EBITDA
Browsing restrictions can be lifted for a fee.
Browsing restrictions can be lifted for a fee.
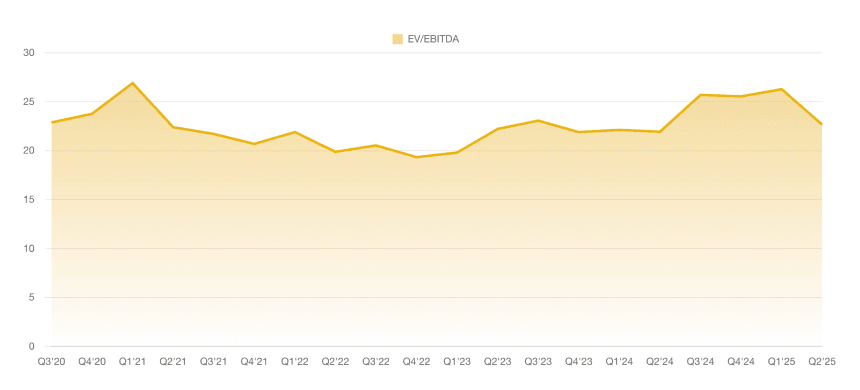
The latest data point for CRNC's EV/EBITDA ratio in Q2'26 stands at -148.86, indicating a significant deterioration in valuation relative to earnings, following a positive reading of 7.51 in Q1'26. Over the period from Q3'23 to Q2'26, the EV/EBITDA ratio has exhibited extreme volatility, starting with a negative -5.38 in Q3'23 and plunging to a low of -503.26 in Q3'25, with intermittent positive spikes such as 16.71 in Q1'24 and 49.12 in Q4'25. This erratic pattern reflects underlying operational instability or market fluctuations, with no sustained upward or downward trend, underscoring the need for caution in assessing the company's financial health.