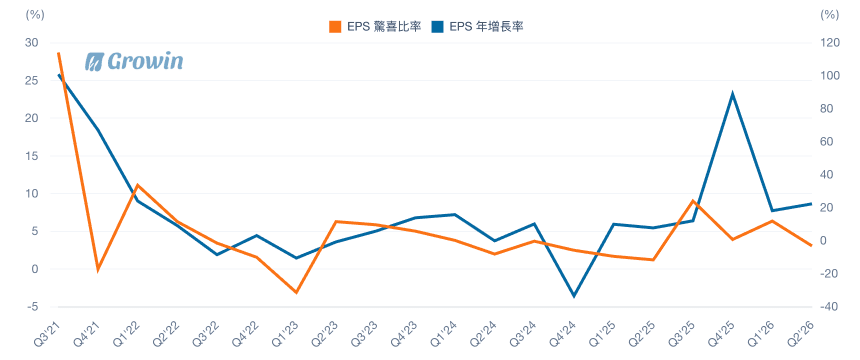
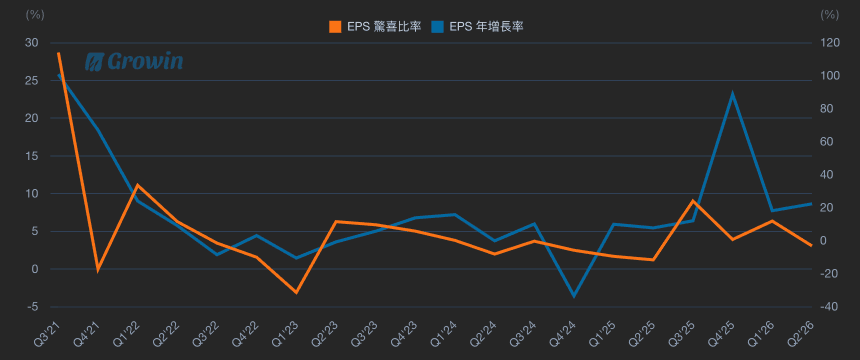
AMD EPS Surprise %
Browsing restrictions can be lifted for a fee.
Browsing restrictions can be lifted for a fee.
The latest data point for AMD's EPS Surprise % in Q1'26 stands at 6.20%, indicating a positive deviation from analyst expectations and marking a solid performance in the most recent quarter. This value reflects a moderate surprise, building on the exceptionally strong 15.91% surprise in the prior Q4'25 period, while EPS Growth (YoY) for Q1'26 is 0.93%, suggesting tempered year-over-year expansion compared to earlier highs. Over the period from Q2'23 to Q1'26, AMD's EPS Surprise % has shown overall volatility with a generally positive trend, fluctuating between a low of -0.22% in Q3'24 and a peak of 15.91% in Q4'25, including a flat 0% in Q4'23; notable improvements occurred post-2024, with consistent positives in seven of the last eight quarters. In parallel, EPS Growth (YoY) exhibited sharp swings, starting with a steep -92.86% decline in Q2'23, rebounding to a high of 40% in Q4'23, and stabilizing around 0.58% to 4.50% in recent quarters, highlighting resilient recovery amid periodic contractions like -0.29% in Q4'24. This dual-line chart underscores AMD's improving earnings trajectory, though with ongoing variability that financial analysts should monitor for sustained momentum.