
AI EV/EBITDA
Browsing restrictions can be lifted for a fee.
Browsing restrictions can be lifted for a fee.
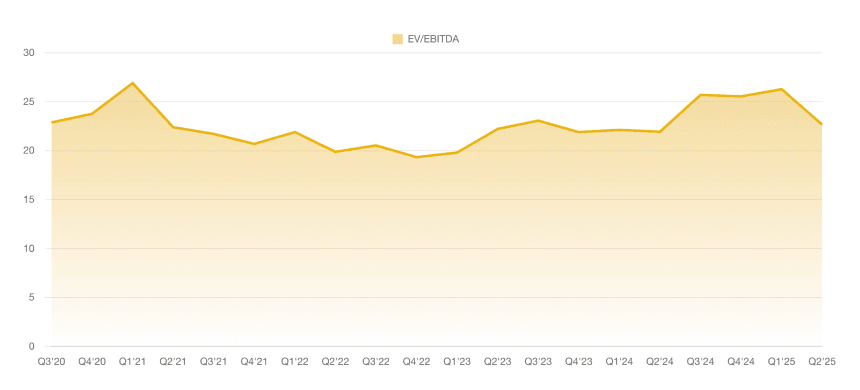
The latest data point for AI's EV/EBITDA ratio in Q3'26 stands at -2.994, marking a continued narrowing of the negative valuation multiple from the prior quarter's -5.871 in Q2'26. This improvement suggests a potential stabilization in the company's operational efficiency or market perception, though the negative value still indicates ongoing challenges in generating positive EBITDA relative to enterprise value. Over the period from Q4'23 to Q3'26, the EV/EBITDA ratio has exhibited a volatile yet overall improving trend, starting at -15.853 and fluctuating between -20.223 (Q2'25 low) and -6.361 (Q1'26 high), before steadily climbing toward less negative territory in recent quarters. Key inflection points include a sharp deterioration in Q3'24 to -17.142 and Q2'25 to -20.223, followed by a recovery pattern that highlights potential growth in EBITDA or reduced enterprise value pressures. As an area chart depiction, this underscores persistent negativity but a directional shift toward breakeven, warranting monitoring for sustained positive momentum.