
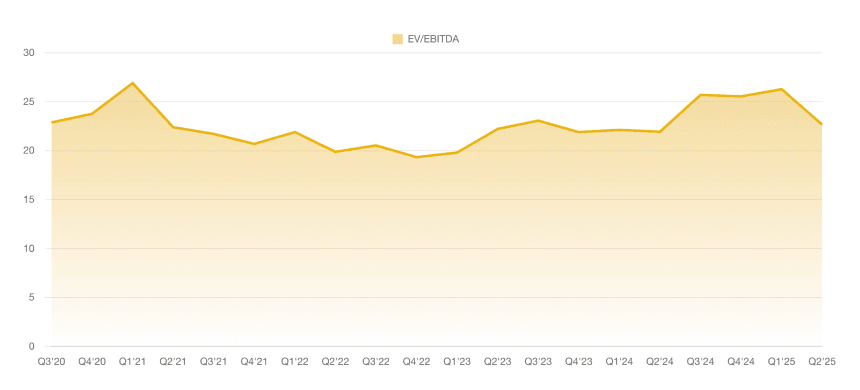
ABNB EV/EBITDA
Browsing restrictions can be lifted for a fee.
Browsing restrictions can be lifted for a fee.
The latest data point for ABNB's EV/EBITDA ratio in Q1'26 stands at 796.26, marking a dramatic surge from the previous quarter's value of 21.05 in Q4'25 and indicating potential volatility or exceptional circumstances in valuation metrics. Over the period from Q2'23 to Q1'26, the EV/EBITDA ratio exhibited significant fluctuations, starting at 34.47 in Q2'23, declining to a low of 20.27 in Q3'25, and stabilizing around 21-24 in the subsequent quarters before the sharp outlier in Q1'26; this pattern suggests an overall volatile trend with a general downward trajectory until the recent spike, potentially reflecting improving operational efficiency or market reassessment in earlier periods.